The correct reporting of pharmacokinetic data can provide a tremendous amount of information on the clinical pharmacological characteristics of a drug. Small studies with a limited number of plasma samples can already be informative for others, especially in special populations where information is already limited. However, regardless of the sample size of the study, from extensive phase 1 studies to opportunistic sampling strategies in patients, the information that can be retrieved by other researchers from the published results is dependent on the way the report is written and the results are presented.
There is currently no standard in the reporting of pharmacokinetic data and this can be seen in the all the different ways authors publish their results, which range from solely the reporting of a mean concentration across multiple timepoints, the reporting of a full population pharmacokinetic model with covariates and corresponding model code in a model repository (e.g. ddmore, or many articles in the JPKPD, CPT:PSP, or BJCP), to all types of statistical parameters and visualisations in between.
Fortunately, there are a number of publications available that address this problem and try to create a guideline for this reporting, such as the ‘Reporting Guidelines for Clinical Pharmacokinetic Studies: The ClinPK Statement’ article published in 2015. It is not open access… but luckily it can be downloaded from the researchgate page for those who are interested. Additionally, Comets et al wrote A survey of the way pharmacokinetics are reported in published phase I clinical trials, with an emphasis on oncology. Therefore, some topics of this post are also discussed in these or other publications.
The highest level of information
If at all possible, the individual pharmacokinetic data should be shared in a repository, in a table within the publication, or as a supplemental material. This provides the opportunity for others to perform a meta-analysis of all available data between publications, instead of solely working with the mean plus/minus the standard deviation extracted with a plot digitizer. Unfortunately, this is not very common and researchers may be hesitant to share their data for others to use. Hopefully new initiatives such as the PK-DB (PharmacoKinetics DataBase) may assist in making this step a little bit easier.
Besides the individual concentrations, the individual patient characteristics are just as important. It should be known what population was studied, if any comedication is administered, any comorbidities a patient might have, and the individual patient characteristics such as age, weight, BMI, male/female, etc. If weight based dosing is applied (e.g. mg/kg) the given dose should be reported as well.
If no individual patient characteristics are given, attention should be given to the reporting of the summary of these characteristics. The goal of this reporting should be that the reader is able to understand what the distribution of patients across, for example, the age or weight range was.
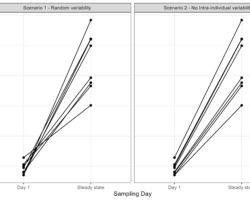
Question: if we report the mean and the standard deviation of the weight of our patients, do we have enough information to know the distribution of the individual weights? Well, it depends. If it was a normally distributed population we can simulate this mean only the mean and standard deviation. However, if we are studying men and women, we may quickly see a binomial distribution on which a mean value does not give the correct description. Even worse is the use of a standard deviation when studying the pediatric population, in which the mean minus 1 SD might already result in negative ages due to a skewed distribution of the data. Therefore, summarizing the patient characteristics should be dependent on the distribution of the data and it can be reported with the mean, median, inter-quartile range, range, standard deviation, or other summary statistics might be used if applicable.
The same holds true for the reporting of the results of non-compartmental analysis. In which a boxplot (commonly showing the median, IQR, and outliers) with an overlay of the individual data points might be more informative than a table with the mean and standard deviation of that parameter.
Variability versus uncertainty
Besides numerical results, let’s have a look at the simulated pharmacokinetic profiles below. These plots mimic the typical representation of pharmacokinetic data collected in a study.
So let us try to interpret these concentration-time profiles: would you feel comfortable administering the drug studied in plot A or would you rather use the drug of plot B? Plot B right?
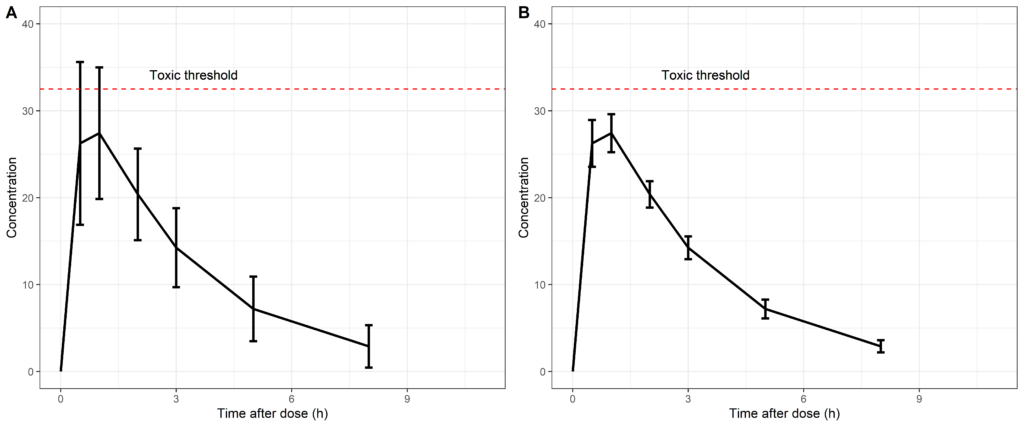
Looking at plot B, we would most likely conclude that the pharmacokinetics of this drug has a much lower level of variability and the administered dose would be well below the toxic threshold. However, this interpretation would be false since we are presenting the standard deviation in plot A versus the standard error of the mean in plot B. This is sometimes only reported in the caption of the figure but it can have a huge impact on the interpretation of the results.
In statistics, we mostly look at the standard error of the mean and confidence intervals. We want to know if the two populations that we are comparing truly are different and if the means do not overlap. Therefore, we need to know how certain we are in these means, hence, a standard error of the mean is given. This standard error can be derived from the standard deviation and the sample size, and vice versa, as can be seen below.

From these equations it can be concluded that when a large sample size is being studied, we have a very small standard error of the mean. However, are we at all interested in this when visualizing the pharmacokinetic data in a population?
I would say not. We administer a drug to a population which results in an individual pharmacokinetic profile over time, that results in an effect, following a concentration-effect relationship. Therefore, the variability from one patient to another in the obtained concentration is highly informative on the observed effects within that individual. Also as can be seen from the figures above, a high level of variability in a population can inform us on potential under/overdosing of a patient, regardless of how certain we are of the ‘mean patient’ of that population.
Unfortunately, this happens a lot and every time I encounter such a figure I am dumbfounded with the interpretation of such figures. Therefore, please do not report the standard error of the mean of pharmacokinetic data when we are interested in the variability in the population, even though this may look crappier than the small standard errors.
Side note: when the goal of the study is to compare the pharmacokinetics of 2 groups, for example with bioequivalence testing, the standard error of the Cmax or AUC should of course be used to assess if the 2 groups are significantly different. However, it is debatable whether the concentration-time profiles should then also be reported with the standard errors.
Reporting of population pharmacokinetic models
Once the pharmacokinetic data is passed from the clinical pharmacologists/statistician to a pharmacometrician, the way of reporting is (luckily) more standardized. For the correct reporting of population pharmacokinetic models, many publications have been written, by research groups as well as by regulatory authorities.
There are examples on how pharmacometricians can make their results more accessible for others, as is in the author guidelines of Clinical Pharmacokinetics (https://link.springer.com/article/10.1007/s40262-013-0114-1), but perhaps it is time to also inform researchers outside the field of pharmacometrics on how the correct reporting of pharmacokinetic data can assist pharmacometricians in providing more evidence based dosing optimizations in all populations?
Any further suggestions?
Let me know if you have any other ideas on this topic! Leave a comment or contact me at info@pmxsolutions.com!